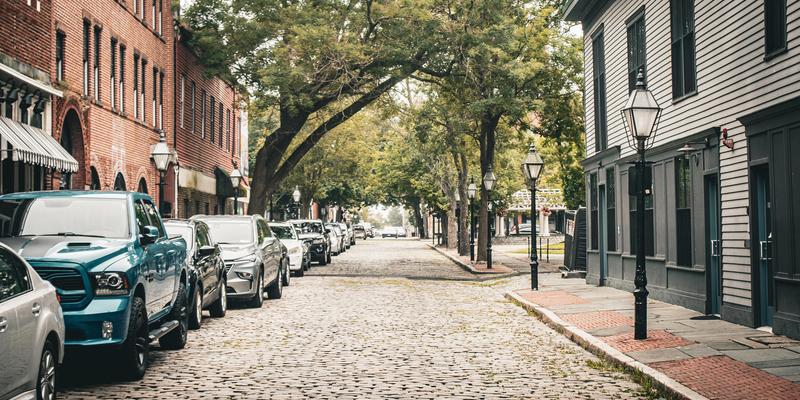
Municipalities often treat sidewalks, street trees, and traffic calming as decorative enhancements. In reality, walkability functions as core economic infrastructure. Redesigning downtown streets to prioritize pedestrian movement directly increases local sales tax revenue, commercial property valuations, and private capital investment. This guide outlines how Georgia downtowns measure return on investment (ROI) for streetscape capital projects, which makes it a natural companion to my posts on Tax Allocation District funding and adaptive reuse deal structuring.
1. The Economics of Pedestrian Infrastructure
When you rebuild a street for pedestrians, you alter consumer behavior. Car-oriented corridors encourage quick single-stop trips. Walkable downtowns encourage multi-stop visits, longer dwell times, and higher retail spending per visit.
Tax Yield Per Acre
Downtown multi-story commercial blocks produce higher municipal tax returns than highway strip retail. While a suburban big-box store yields $2,000 to $5,000 per acre in local property tax, a traditional Georgia downtown block yields $15,000 to $45,000 per acre [1]. Compact, walkable design maximizes the productivity of limited city land.
Property Valuation Impact
Commercial property value increases alongside pedestrian access. Research confirms that each point increase in Walk Score correlates to a $1,000 to $3,000 increase in property value [2]. High walkability ratings reduce tenant turnover, lower vacancy rates, and command higher ground-floor commercial rent rates.
Walkability directly multiplies municipal tax yield per acre.
2. Core Georgia Funding Sources for Streetscape Projects
Funding streetscape capital projects does not require relying entirely on municipal general funds. You can stack state transportation grants, regional planning funds, and local option sales taxes to fund construction.
GDOT Transportation Alternatives (TA) Program
Administered by the Georgia Department of Transportation, the GDOT Transportation Alternatives Program provides federal funds for pedestrian infrastructure [3]. Local governments can secure funding for sidewalk construction, ADA compliance, pedestrian lighting, and crosswalk safety upgrades along commercial corridors.
GDOT Local Maintenance & Improvement Grant (LMIG)
Georgia cities use annual allocations from the GDOT LMIG Program to fund street resurfacing, curb replacement, and pedestrian safety upgrades [4]. Combining LMIG funds with local matching capital helps cities complete curb extensions and crosswalk improvements on state routes running through downtowns.
Regional MPO and ARC Livable Centers Initiative (LCI)
The Atlanta Regional Commission and regional Metropolitan Planning Organizations offer LCI planning and transportation grants. The ARC Livable Centers Initiative funds streetscape designs, traffic calming, and pedestrian network connections for downtown districts committed to mixed-use development [5].
SPLOST and T-SPLOST Allocations
Special Purpose Local Option Sales Tax (SPLOST) and Transportation SPLOST (T-SPLOST) funds allow counties and municipalities to dedicate sales tax revenue directly to voter-approved streetscape projects.
| Funding Program | Administering Agency | Typical Local Match | Permitted Uses |
|---|---|---|---|
| GDOT TA Program [3] | Georgia Department of Transportation | 20% local match | Sidewalks, pedestrian lighting, trail connections |
| GDOT LMIG [4] | Georgia Department of Transportation | 10% to 30% local match | Resurfacing, curb replacement, crosswalk upgrades |
| ARC LCI Program [5] | Atlanta Regional Commission / MPOs | 20% local match | Streetscape construction, transit access, planning |
| T-SPLOST | Municipal / County Government | 0% (Direct local tax) | Road design, sidewalk networks, traffic calming |
| DCA CDBG Infrastructure [6] | Georgia Department of Community Affairs | Varies by community | Water, sewer, and sidewalk upgrades in target zones |
3. Key Financial Metrics to Track Streetscape ROI
To prove financial returns to city councils, Downtown Development Authorities, and property owners, track these baseline metrics before and after project completion. These same indicators also strengthen the public-side case for incentive tools and partnership structures in Georgia downtown deals.
1. Local Option Sales Tax (LOST) Revenue Growth
Track retail and restaurant sales tax generation inside the project zone. Compare sales tax growth in the rebuilt streetscape district against a control corridor over a 24-month post-construction period.
2. Private Capital Reinvestment Ratio
Calculate the total dollar amount of private building rehabilitation, facade upgrades, and new construction against public funds spent on the streetscape. Target a return ratio of $5 to $10 in private investment for every $1 in public streetscape spending.
3. Commercial Storefront Vacancy Rates
Audit ground-floor commercial vacancies before construction begins. Measure the speed of tenant absorption over 12, 24, and 36 months following streetscape completion.
4. Pedestrian Dwell Time and Volume
Deploy infrared pedestrian counters or mobile location analytics to measure daily foot traffic volume. Increasing average pedestrian stay times from 15 minutes to 45 minutes directly expands restaurant and retail sales.
4. High-Yield Streetscape Design Elements
Focus public capital on specific physical streetscape features that drive retail sales and property values.
Outdoor dining space expands restaurant revenue capacity without adding building footprint.
Sidewalk Widening and Outdoor Dining
Converting parallel parking spots or wide travel lanes into 10-to-15-foot wide sidewalks allows restaurants to add outdoor dining tables. Outdoor seating increases restaurant seating capacity by 15% to 30%, increasing meal tax revenue and retail activity.
Curb Extensions (Bulb-Outs)
Bulb-outs shorten crosswalk distances for pedestrians while visually narrowing travel lanes to slow vehicle traffic. Reducing pedestrian crossing distance across state routes encourages foot traffic between opposite sides of the street.
Shade Canopy and Street Trees
Georgia summers bring extreme heat that clears unshaded sidewalks. Planting mature street trees lowers ambient surface temperatures by 10 to 15 degrees Fahrenheit, preserving afternoon foot traffic during summer months.
Pedestrian Scale Lighting
Standard streetlights illuminate vehicle lanes from 30 feet high. Pedestrian lighting sits 12 to 15 feet high, focusing light on sidewalks and storefront windows. Proper lighting extends active commerce hours past 5:00 PM.
5. Implementation Playbook for Georgia Municipalities
- Establish Baseline Data: Record sales tax revenues, property assessments, vacancy rates, and pedestrian counts for 12 months prior to project design.
- Engage GDOT Early: If your downtown streetscape involves a state route, initiate coordination with your regional GDOT district office during preliminary design to secure encroachment permits.
- Phase Construction to Protect Merchants: Execute sidewalk construction block-by-block during off-peak retail months. Install clear pedestrian access signage and temporary walkways to keep storefronts open.
- Publish Annual ROI Reports: Track tax growth and private investment metrics annually. Use performance data to justify future capital improvements in surrounding downtown zones.
Frequently Asked Questions
Because pedestrian-oriented streets increase dwell time, improve retail performance, strengthen property values, and raise the tax productivity of downtown land.
The post highlights GDOT Transportation Alternatives, LMIG, ARC and MPO planning grants, SPLOST or T-SPLOST revenue, and DCA CDBG infrastructure funding.
Track local sales tax growth, private reinvestment ratios, storefront vacancy rates, and pedestrian volume and dwell time before and after project completion.
References
- Minicozzi, Joseph. (2012). The Smart Math of Mixed-Use Development. Urban Land Institute. https://americas.uli.org/
- Cortright, Joseph. (2009). Walking the Walk: How Walkability Raises Housing Values in U.S. Cities. CEOs for Cities. https://www.walkscore.com/professional/research
- Georgia Department of Transportation. (2024). Transportation Alternatives Program (TAP) Manual and Application Guidelines. Georgia Department of Transportation. https://www.dot.ga.gov/GDOT/Pages/TAP.aspx
- Georgia Department of Transportation. (2024). Local Maintenance & Improvement Grant (LMIG) Operating Guidelines. Georgia Department of Transportation. https://www.dot.ga.gov/GDOT/Pages/LMIG.aspx
- Atlanta Regional Commission. (2023). Livable Centers Initiative Program Framework and Funding Guidelines. Atlanta Regional Commission. https://atlantaregional.org/what-we-do/community-development/livable-centers-initiative/
- Georgia Department of Community Affairs. (2024). Community Development Block Grant Program Guidelines. Georgia Department of Community Affairs. https://dca.georgia.gov/search/results